


MT4 - MetaTrader 4
Version 4.00 Build 1160 or greater
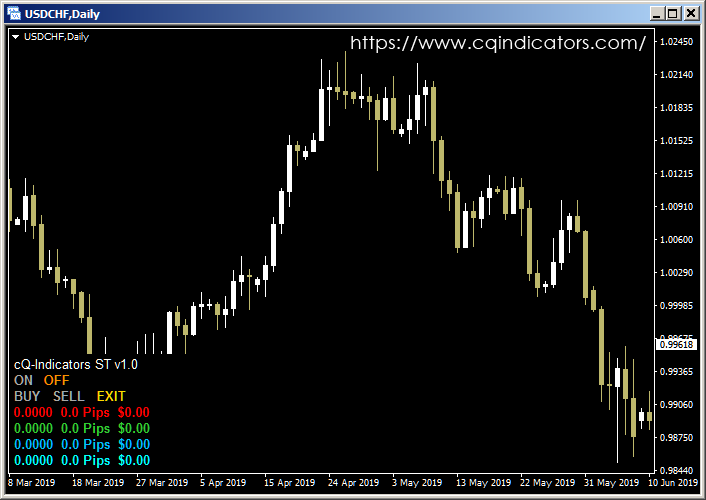
The System Tester is an indicator you can use to manually back test your trading system. When you have completed testing a currency pair it will output all the trades to a CSV file which can be loaded into Excel or Calc.
THIS INDICATOR IS CURRENTLY BEING UPDATED.
DOWNLOAD v1.3 (updated Aug 8, 2019)
It tells you the number of Pips made or loss for each trade as well as the total pips for the test. It also gives you the Expectancy of the trading system which includes the number of WIN and LOSS trades, WIN and LOSS Pips, Odds of Winning and Odds of Losing. It also gives you the Average length of time the trade took. If you are back testing a trading system it would be in your best interest to minimally view the video.
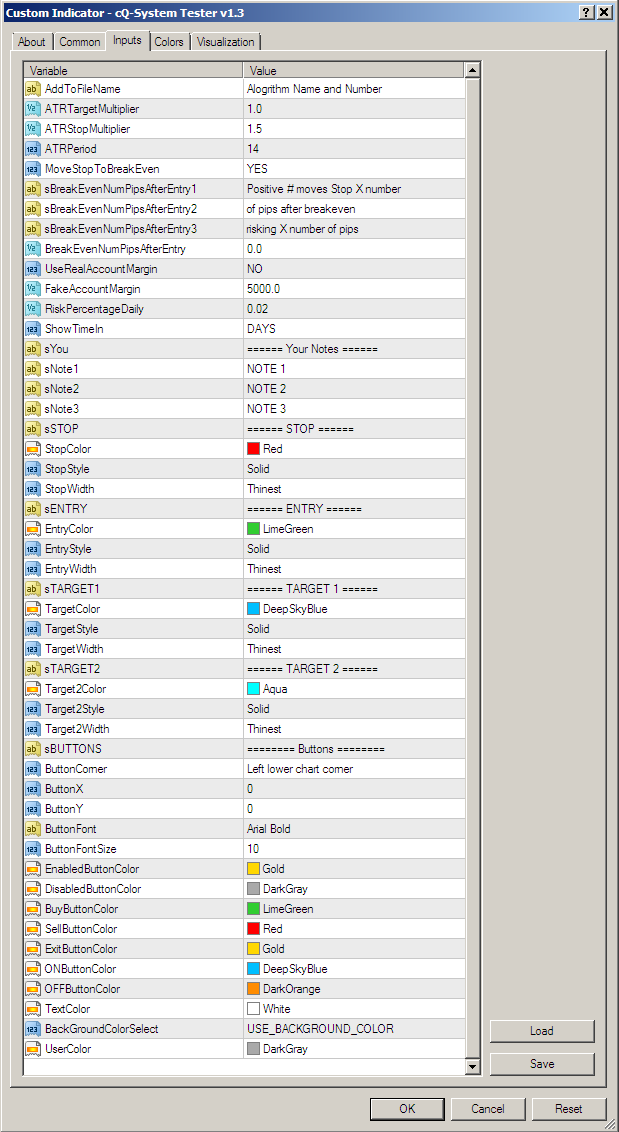
Version 1.1 a number of parameters have been added, with the most important feature is the addition of the "Daily Risk Percentage". Your risk is defined by two variables seen below: "Account Balance" and "Daily Risk Percentage". If you keep these numbers the same for each currency pair you test you'll have better idea of which pairs make the most money, which isn't necessarily the same ones that make the most pips.
The default "RISK" setting is 5000 Dollars for the "Account Balance" and 0.02 for "Daily Risk Percentage". This gives you $100 Dollars of risk total for each trade, or $50 per half trade. If take a look below you may notice the "$" sign (Green). This signifies the number is in Dollars (or your Account Currency). The Expectancy is also shown in both PIPS and DOLLARS.
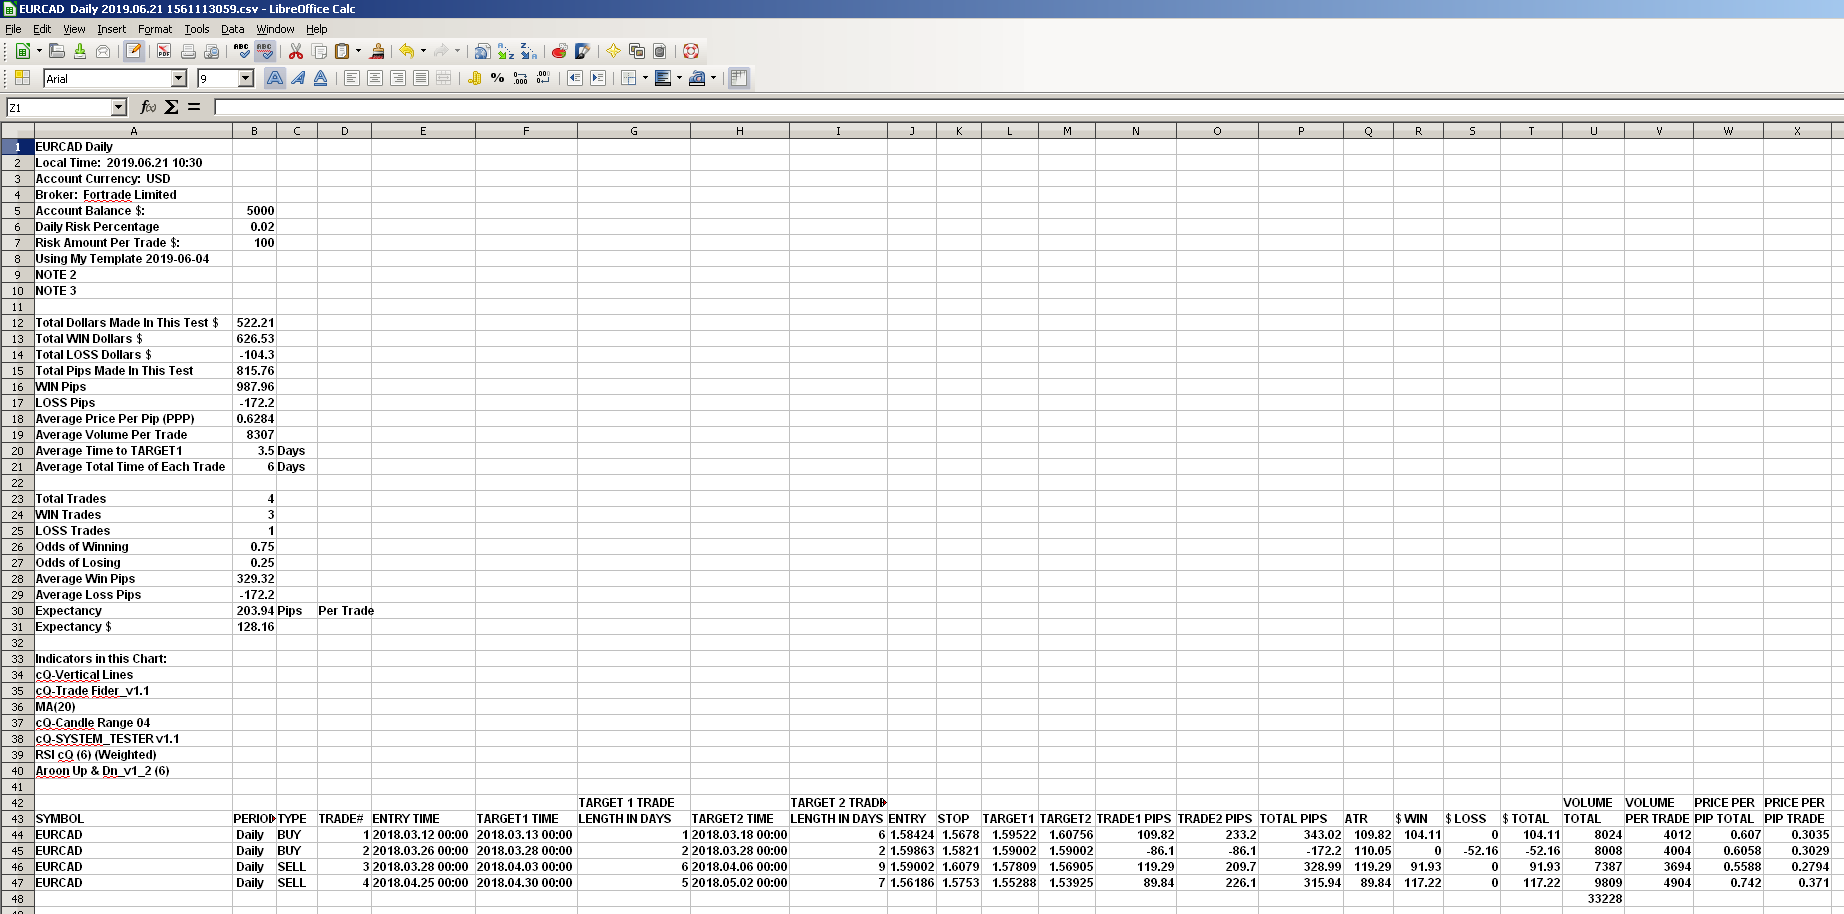
| EURCAD Daily | |||
| Local Time: 2019.06.21 10:30 | |||
| Account Currency: USD | |||
| Broker: Fortrade Limited | |||
| Account Balance $: | 5000 | ||
| Daily Risk Percentage | 0.02 | ||
| Risk Amount Per Trade $: | 100 | ||
| Using My Template 2019-06-04 | |||
| NOTE 2 | |||
| NOTE 3 | |||
| Total Dollars Made In This Test $ | 522.21 | ||
| Total WIN Dollars $ | 626.53 | ||
| Total LOSS Dollars $ | -104.32 | ||
| Total Pips Made In This Test | 815.76 | ||
| WIN Pips | 987.96 | ||
| LOSS Pips | -172.2 | ||
| Average Price Per Pip (PPP) | 0.6284 | ||
| Average Volume Per Trade | 8307 | ||
| Average Time to TARGET1 | 3.5 | Days | |
| Average Total Time of Each Trade | 6 | Days | |
| Total Trades | 4 | ||
| WIN Trades | 3 | ||
| LOSS Trades | 1 | ||
| Odds of Winning | 0.75 | ||
| Odds of Losing | 0.25 | ||
| Average Win Pips | 329.32 | ||
| Average Loss Pips | -172.2 | ||
| Expectancy | 203.94 | Pips |
Per Trade |
| Expectancy $ | 128.16 | ||
| VOLUME | VOLUME | PRICE PER | PRICE PER | |||||||
| TRADE1 PIPS | TRADE2 PIPS | TOTAL PIPS | ATR | $ WIN | $ LOSS | $ TOTAL | TOTAL | PER TRADE | PIP TOTAL | PIP TRADE |
| 109.82 | 233.2 | 343.02 | 109.82 | 104.11 | 0 | 104.11 | 8024 | 4012 | 0.607 | 0.3035 |
| -86.1 | -86.1 | -172.2 | 110.05 | 0 | -52.16 | -52.16 | 8008 | 4004 | 0.6058 | 0.3029 |
| 119.29 | 209.7 | 328.99 | 119.29 | 91.93 | 0 | 91.93 | 7387 | 3694 | 0.5588 | 0.2794 |
| 89.84 | 226.1 | 315.94 | 89.84 | 117.22 | 0 | 117.22 | 9809 | 4904 | 0.742 | 0.371 |