

Requirements
MT4 - MetaTrader 4
Version 4.00 Build 1360 or greater
March 07, 2023
Download cQ-QQE v2.0 Indicator for MT4
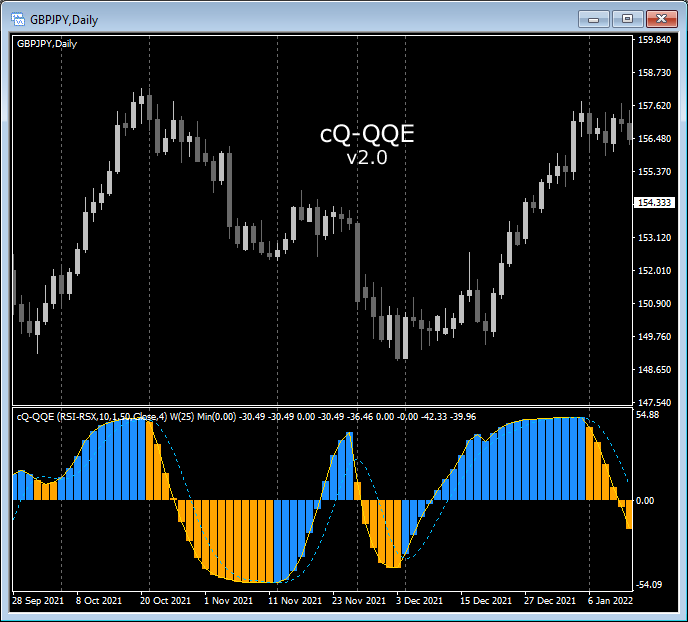
The cQ-QQE indicator can be used as a confirmation or exit indicator or both. You can try using one indicator for confirmation and the other for exit (using different parameters of course). In the No Nonsense trading system it is used as an exit indicator. Version 2.0 has an Adaptive Period based on the ATR. It can be disabled or you can use a different period.
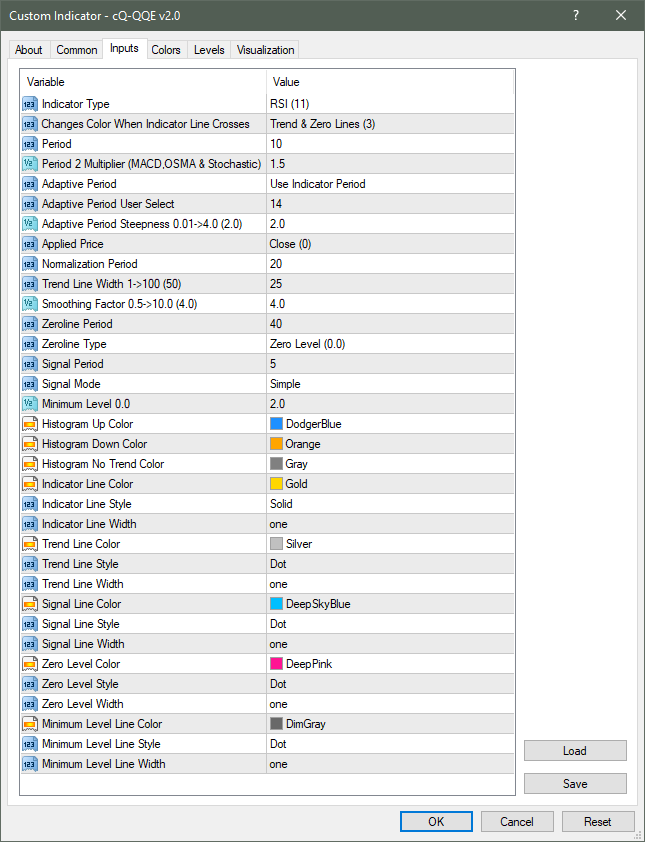
This version of the QQE can use a number of different input indicators in place of the RSI, which is the indicator normally used. You can select from 20 different input indicators:
- Accelerator Oscillator
- ADX
- Awesome Oscillator
- CCI
- Bear/Bulls
- Demarker
- Force Index
- MACD
- Momentum
- Money Flow Index
- OSMA
- RSI
- RSI cQ
- Wilders' RSI
- Harris RSI
- RSI RSX
- Cuttlers RSI
- RVI
- Stochastic
- Williams Percent R
- SMA
- EMA
- SMMA
- LWMA
The indicator has seven different ways of generating the up, down, or no direction histogram bars.
- Zero Line Cross
- Trend Line Cross
- Signal Line Cross
- Trend & Zero Lines Cross
- Signal & Zero Lines Cross
- Signal & Trend Lines Cross
- Trend, Signal, & Zero Lines Crossed
- Entry Mode Trend & AB Zero Level
- Entry Mode Signal & AB Zero Level
- Entry Mode Zeroline & AB Zero Level
- Entry Mode Trend & Signal AB Zero Level
The first being when the indicator line crosses the zeroline. This line can either be the zero level (0.0) or a generated zeroline. The next way is when the indicator line (yellow dotted line) crosses the trend line (white dotted line). The next is the signal line, which a signal line (blue dotted line) is generated from the indicator line (yellow dotted line) and crosses the indicator line. The rest are cominations of these 3 line crosses.
The Trend Line Width parameter is used to determine how for above/below the indicator line. You can use settings larger than 100 if desired.
The Minimum Level can be used to help reduce the noise when price is going sideways. The histogram will turn gray when current level is inside this area.
A Normalization Period is used to normalize the selected input indicator to +/- 50. You can use this number to help determine a suitable Minimum Level.


Requirements
MT4 - MetaTrader 4
Version 4.00 Build 1360 or greater
December 20, 2022
Download cQ-QQE Indicator for MT4
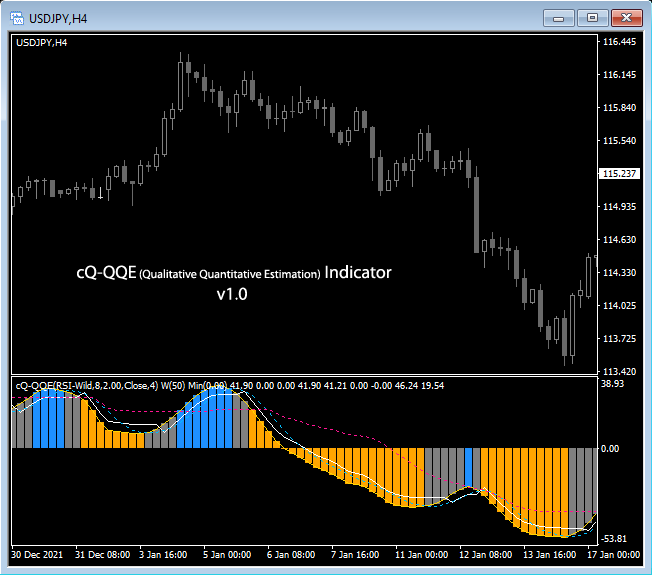
The cQ-QQE indicator can be used as a confirmation or exit indicator or both. You can try using one indicator for confirmation and the other for exit (using different parameters of course). In the No Nonsense trading system it is used as an exit indicator.
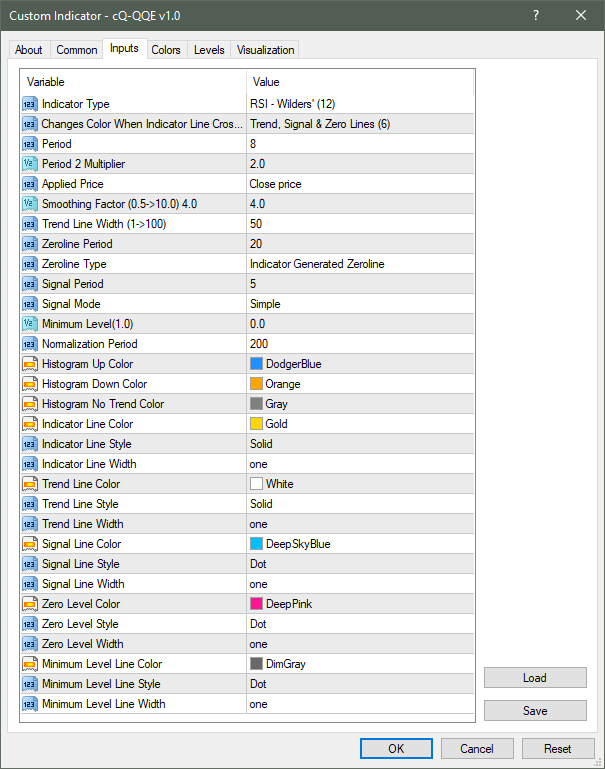
This version doesn't have the adpative period and has fewer input indicators.
The first being when the indicator line crosses the zeroline. This line can either be the zero level (0.0) or a generated zeroline. The next way is when the indicator line (yellow dotted line) crosses the trend line (white dotted line). The next is the signal line, which a signal line (blue dotted line) is generated from the indicator line (yellow dotted line) and crosses the indicator line. The rest are cominations of these 3 line crosses.
The Trend Line Width parameter is used to determine how for above/below the indicator line. You can use settings larger than 100 if desired.
The Minimum Level can be used to help reduce the noise when price is going sideways. The histogram will turn gray when current level is inside this area.
A Normalization Period is used to normalize the selected input indicator to +/- 50. You can use this number to help determine a suitable Minimum Level.
