


(formerly called 'cQ-Baseline DATR BBands')
Requirements
MT4 - MetaTrader 4
Version 4.00 Build 1350 or greater
June 4, 2022 Download the:
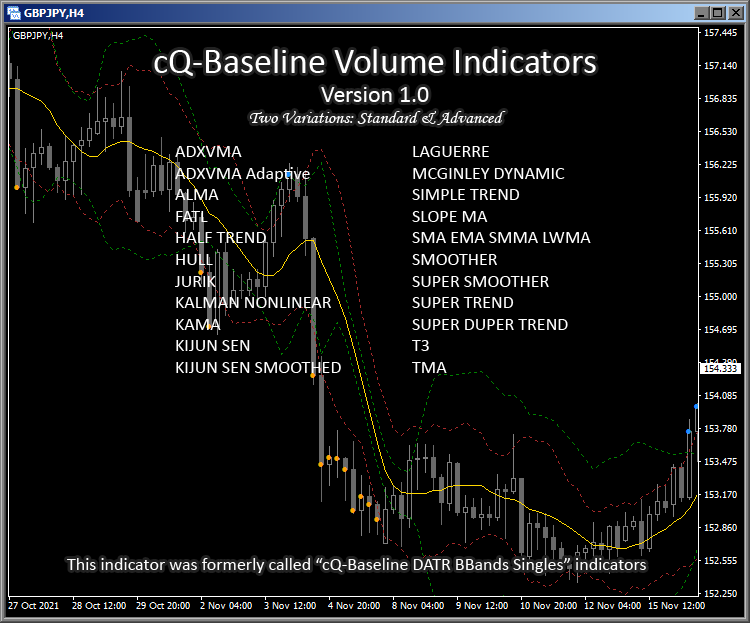
cQ-Baseline Volume Standard & Advanced Indicators v1.0
NOTE: The cQ-Baseline Volume Indicators was formerly called the cQ-Baseline DATR BBands Singles indicators. The cQ-Baseline DATR BBands Singles indicators as well as the cQ-Baseline Trend Direction Singles indicators both apparently had corrupt binaries that failed to work properly. I've determined it had something to do with the MetaEditor and have since started using a different broker's MetaEditor.
The cQ-Baseline Volume Indicators can be used as a volume or confirmation indicator. It also can be used as an entry filter. It's main use is as a volume indicator, but you can use it in conjunction with your current volume indicator or by itself. The basic design uses both BBands and Envelopes to generate volume/volatility points or area where there may be enough volume to enter a trade. Each indicator uses a different Moving Average from which to base its calculations but they all operate pretty much the same.
There are two variations of these indicators the Standard variations and the Advanced variations. The Standard variations are more basic and don't have any extra parameters, while the Advanced variations have the extra parameters. Not all indicators found in the Advanced variations are in the Standard variations. An example is the SuperDuper Trend found in the Advanced variations.
Standard Variations currently included:
- ADXVMA
- ADXVMA ADAPTIVE
- ALMA
- FATL
- HALF TREND
- HULL
- JURIK
- KALMAN NONLINEAR
- KAMA
- KIJUN SEN
- KIJUN SEN SMOOTHED
- LAGUERRE
- MCGINLEY DYNAMIC
- SIMPLE TREND
- SLOPE MA
- SMA EMA SMMA LWMA
- SMOOTHER
- SUPER SMOOTHER
- SUPER TREND
- T3
- TMA
Advanced Variations currently included:
- ADXVMA
- ADXVMA ADAPTIVE
- ALMA
- FATL
- HALF TREND
- HULL
- JURIK
- KALMAN NONLINEAR
- KAMA
- KIJUN SEN
- LAGUERRE
- MCGINLEY DYNAMIC
- SIMPLE TREND
- SLOPE MA
- SMA EMA SMMA LWMA
- SMOOTHER
- SUPER SMOOTHER
- SUPER TREND
- SUPERDUPER TREND
- T3
- TMA
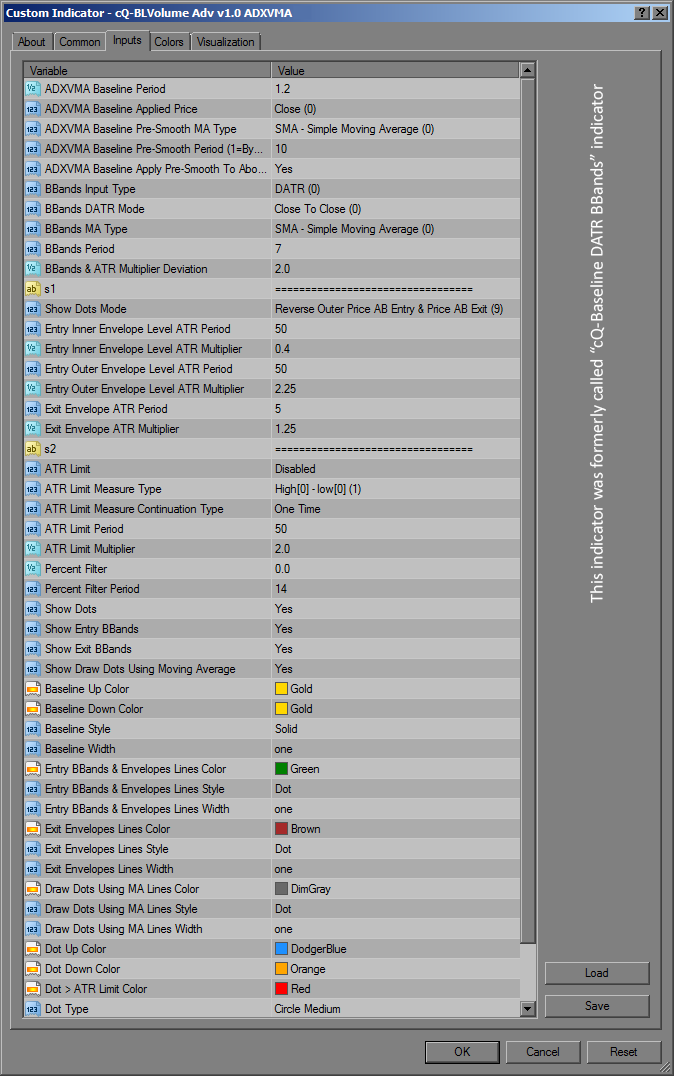
There are currently 11 Show Dots Modes which are explained in the above video. Each mode combines the use of both BBands and ATR Envelopes to generate entry dots. For a BUY a blue dot is drawn, for a SELL an orange dot is drawn, and a red dot for entry points that are greater than the selectable ATR limit.
The Show Dots Modes (AB = Above or Below)
For example mode 1. Price AB Entry reads - When Price is Above or Below the Entry BBands
- Price AB Entry
- Reverse Price AB Entry
- Price AB Exit
- Entry AB Exit Default
- Price AB Entry & Entry AB Exit
- Reverse Price AB Entry & Price Within Exit
- Reverse Outer Price AB Entry
- Reverse Outer Price AB Entry & Entry AB Exit
- Reverse Outer Price AB Entry & Price AB Exit
- Reverse Outer Price AB Entry & Entry Within Exit
- Reverse Outer Price AB Entry & Price Within Exit
There are 8 BBands Calculation modes:
1. DATR Normal - This mode uses the DATR to calculate both the upper and lower bbands rather than use price. Since the DATR is directional, each BBand will be created using different data. "Normal" means it is being calculated using the standard bbands type of calculation.
2. DATR Alternative - This mode is the same as mode #1 but a different method is used to calculate the bbands.
3. DATR Normal Reversed - This mode is the same as mode #1 with the exception that the bbands are reversed, meaning the upper bband is used in place of the lower bband, and vice-versa.
4. DATR Alternative Reversed - This is the same as mode #2 with the exception that the bbands again are reversed.
5. Price Input - This mode uses price directly to calculate the bbands.
6. Price High & Low Normal - This mode uses the High to calculate the upper band and the low to calculate the lower band, instead of the close.
7. Price High & Low Normal Reversed - this mode is the same as mode #6 but with the bbands reversed.
8. Price High & Low Alternative - This mode is the same as mode #6 but uses the alternative way of calculating the bbands.
9. Price High & Low Alternative Reversed - This mode is the same as mode #8 but with the bbands reversed.
ATR Limit Measure Type
There are 8 ways you to test if you should get in the trade:
1. Close[0] - Close[1] - If the distance between the current close and the previous close is greater than the selected ATR limit then a red dot is printed on the chart. This is taken to mean that there's too much volatility and a trade shouldn't be ordered.
2. High - Low - This uses the range of the current candle to test if its greater than the ATR Limit.
3. Distance for the Exit Envelopes - This measures the distance from the trend exit envelope to the current close and prints a red dot if it's greater than the ATR Limit. The "trend exit envelope" is the red dotted line in the above image. Its the upper envelope in an uptrend, and vice-versa.
4. Distance From the Baseline - This is the default setting, if the distance from the current close to the baseline is greater than the ATR Limit, then red dot is printed.
5. Distance From the Exit Envelopes or Close[0] - Close[1] - this type generates a red dot when either the distance of the current close to the Exit Envelope, or the Close[0]-Close[1] is greater than the ATR Limit.
6. Distance From the Exit Envelopes or High - Low - this type generates a red dot when either the distance of the current close to the Exit Envelope, or the High-Low is greater than the ATR Limit.
7. Distance From the Baseline or Close[0] - Close[1] - this type generates a red dot when either the distance of the current close to the Baseline, or the Close[0]-Close[1] is greater than the ATR Limit.
8. Distance From the Baseline or High - Low - this type generates a red dot when either the distance of the current close to the Baseline, or the High-Low is greater than the ATR Limit.
There are 33 moving average types to choose from, for both the baseline and the bbands calculation. You can also use a different period for the bbands than that used for the baseline. This allows for you to find a unique entry point.
To get a better idea of what the indicator does watch the video.
This version does not have any buttons so the subwindow indicator isn't required.