


As an Amazon Associate, I earn from qualifying purchases.
Requirements
MT4 - MetaTrader 4
Version 4.00 Build 1360 or greater
Sept 20, 2023
Download the cQ-DATR OCHL Ratio and cQ-OCHL Ratio MT4 Indicators
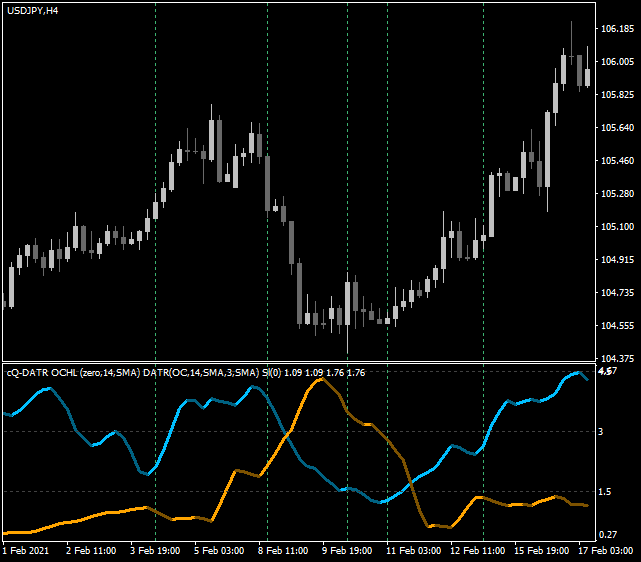
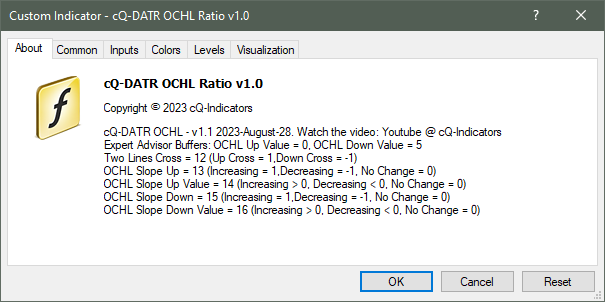
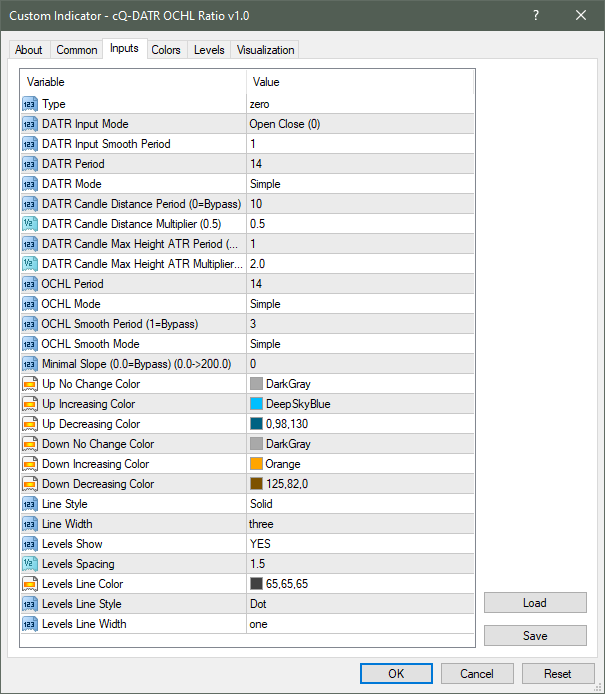
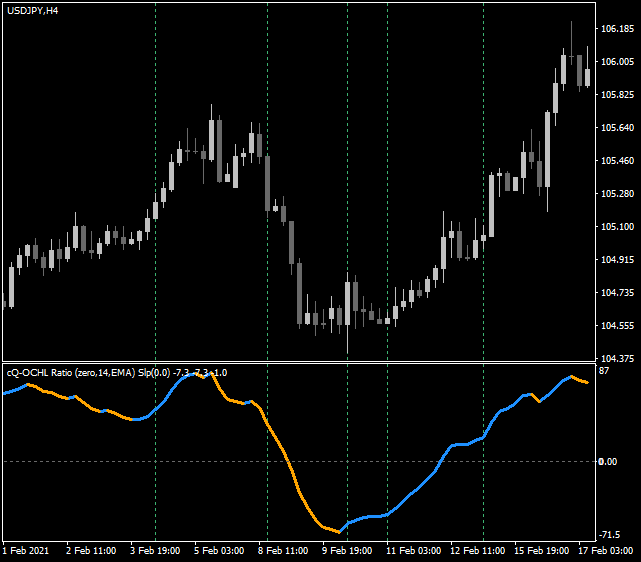
The cQ-DATR OCHL Ratio indicator is a confirmation indicator. There are two lines one for the up direction and the other for the down direction. If the indicator is up and increasing then the indicator will draw a brighter blue color. If the indicator is up and decreasing then it will draw a darker blue color. If the indicator hasn't change then it will draw a gray color. The same thing for the down indicator line except the color will be a brighter orange color and a darker orange (brown) color.
Basically the OCHL Ratio is calculated by dividing the DATR value by the ATR. Each DATR buffer (up and down) can then be smoothed, see the code below.
The input of the indicator is the DATR which is then sent to the OCHL Ratio module. There are two DATR Input Modes: Open_Close and High_Low. This is the value that is placed in the DATR buffers. If the current close of the candle is greater than the current open then the AbsolueValue(close-open) is put in the up buffer and a 0.0 value is put in the down buffer. If the current close is less than the current open then AbsoluteValue(close-open) is placed in the down buffer and the up buffer value is set to 0.0. The DATR Input Smooth Period allows for a longer period to be used. This will average either the high-low or AbsoluteValue(close-open) over the period which gives a smoother response.
There are two input pre DATR functions and one DATR post function that to the DATR-OCHL calcuation. The first pre-DATR function is the Candle Distance (an ATR value). It is a distance added or subtracted from the previous open. If the close[i] > open[i+1]+CandleDistance then either the high-low or Abs(close-open) is placed in the Up Buffer. If the close[i] < open[i+1]-CandleDistance the either the high-low or Abs(close-open) is placed in the down buffer. Otherwise the up or down buffer is set to 0.0. This helps remove smaller sizeways price action from entering the DATR up or down buffers. The Candle Distance is the ATR controlled by the Candle Distance Period and the Candle Distance Multiplier.
The 2nd pre-DATR function is the Candle Max Height (also an ATR value) will limit the height of the candles to the ATR amount controlled by the Candle Max Height Period and Candle Max Height Multiplier. This will limit the affect really large candles have on the calculation.
After the DATR and OCHL are calculated the Slope ATR (an ATR value) function is applied. This function will increase the amount of slope, the distance from the current momentum value and the previous momentum value, required to change the color to either the Brighter Blue or Brighter Orange. Increasing the Slope ATR Multipler will change the more the Brighter colors to Gray, meaning momentum hasn't changed. This will delay the time of possilble trade entry. It doesn't change anything else.
Here is the code of the cQ-DATR OCHL Ratio indicator:
Requirements
MT4 - MetaTrader 4
Version 4.00 Build 1360 or greater
Sept 20, 2023
Download the cQ-DATR OCHL Ratio and cQ-OCHL Ratio MT4 Indicators
Watch the cQ-DATR OCHL Video above to see how the indicator operates
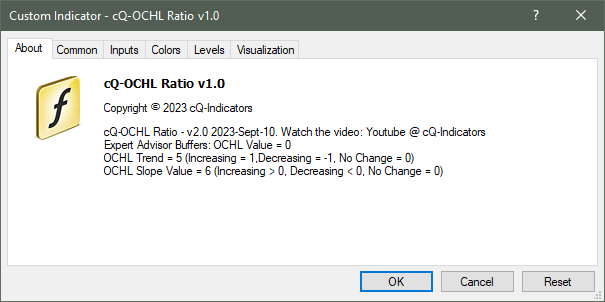
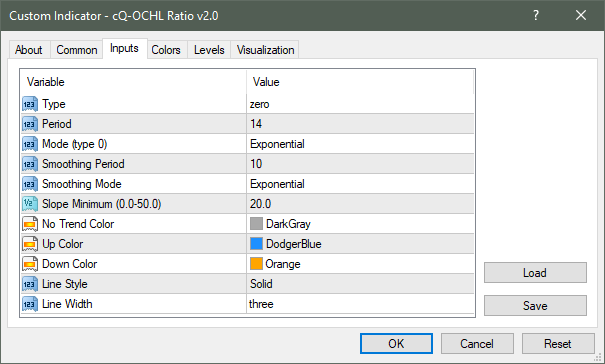
The cQ-OCHL Ratio indicator is a confirmation indicator. This indicator is the very similar as the cQ-DATR OCHL Ratio version above but without the DATR. It is a single line indicator that changes color on the slope change. The calculation of the indicator is similar to the one above except that the input is calculated using close[i]-close[i+OCHLPeriod] in place of the DATRUp and DATRDown values.
The single line will turn a blue color when going in the Up direction and turn an orange color when going in the down direction.
Basically the OCHL Ratio is calculated by dividing the close[i]-close[i+OCHLPeriod] value by the ATR.
Here is the code:
Requirements
MT4 - MetaTrader 4
Version 4.00 Build 1160 or greater
July 7, 2021
Download OCHL Ratio MT4 Indicator v1.1
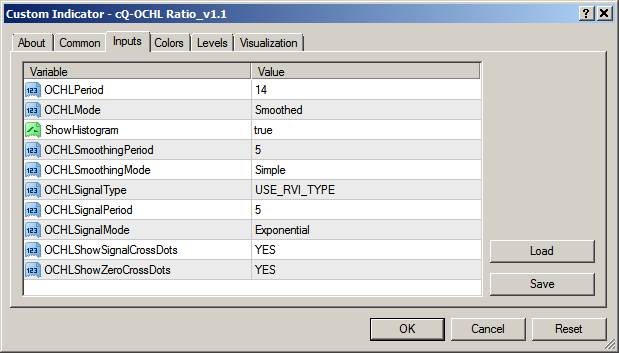
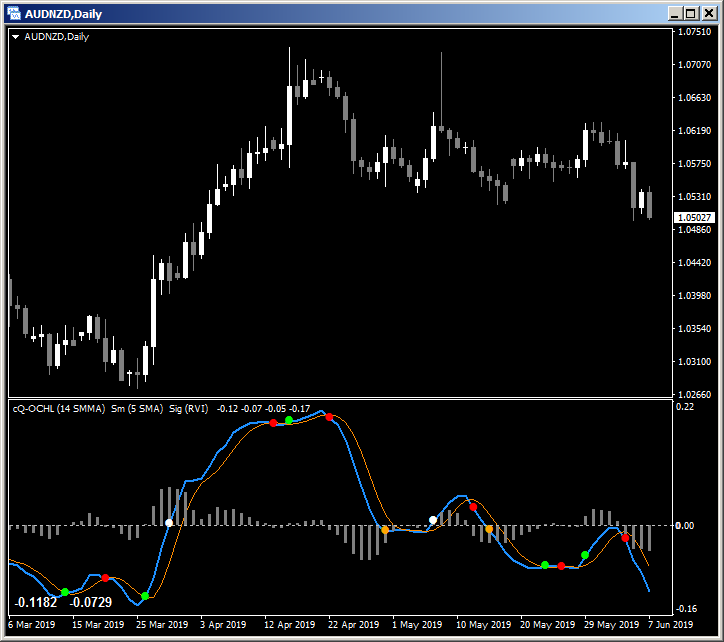
The OCHL Ratio indicator is confirmation indicators. It uses a ratio between the Open & Close verses the High & Low of the candle. It includes a Smoothing factor as well as a Signal. It can be used as an ENTRY or EXIT indicator when used in combination with other indicators. The Signal can be a SMA, EMA, SMMA, LWMA, moving average as well as an RVI type. The RVI type follows the OCHL main rather closely.
The GREEN and RED dots signify when the main has crossed UP or DOWN over the Signal. The WHITE and ORANGE dots represent when the indicator has crossed ABOVE or BELOW the "0.0" level.