


As an Amazon Associate, I earn from qualifying purchases.
Requirements
MT4 - MetaTrader 4
Version 4.00 Build 1350 or greater
You may be interested in the cQ-Baseline Volume Standard & Advanced Indicators which operate in the same fashion as this indicator.
Download the cQ-Baseline DATR BBands v2.0 April 25, 2022
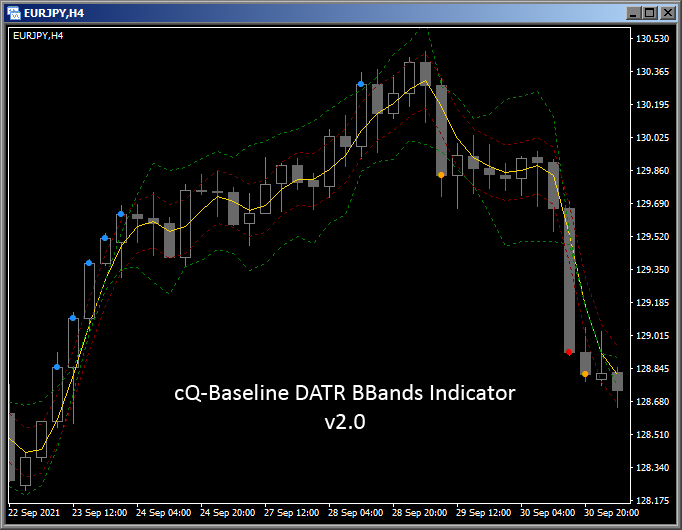
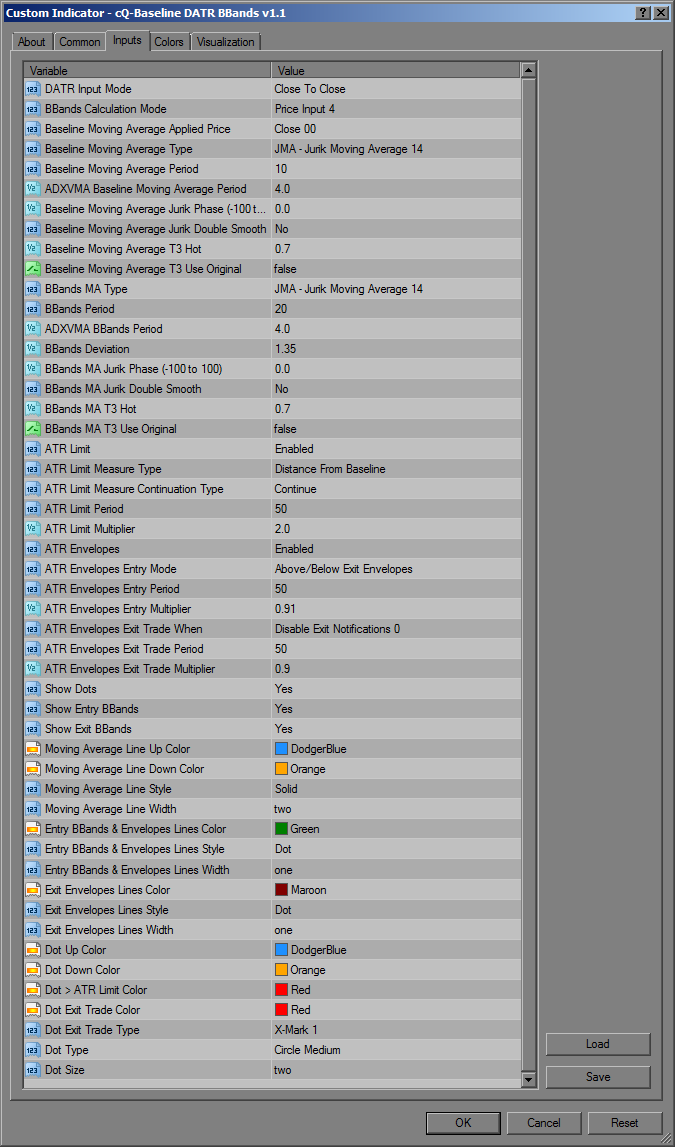
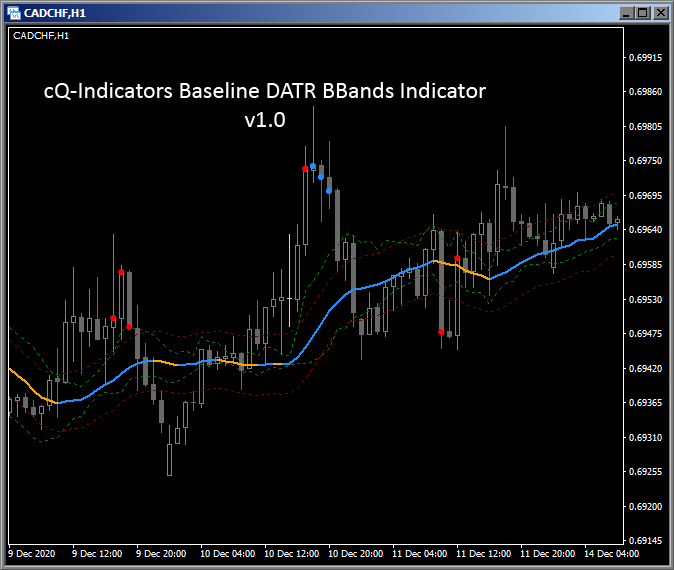
This is version 2.0 of the cQ-Baseline DATR BBands Indicator. It's main use is to be a volume indicator but can be used as an entry filter or even a confirmation indicator. It uses both BBands and Envelopes to generate volume/volatility points or area where there may be enough volume to enter a trade. You can use it in conjunction with your current volume indicator or by itself.
There are currently 11 Show Dots Modes which are explained in the above video. Each mode combines the use of both BBands and ATR Envelopes to generate entry dots. For a BUY a blue dot is drawn, for a SELL an orange dot is drawn, and a red dot for entry points that are greater than the selectable ATR limit.
The Show Dots Modes (AB = Above or Below)
For example mode 1. Price AB Entry reads - When Price is Above or Below the Entry BBands
- Price AB Entry
- Reverse Price AB Entry
- Price AB Exit
- Entry AB Exit Default
- Price AB Entry & Entry AB Exit
- Reverse Price AB Entry & Price Within Exit
- Reverse Outer Price AB Entry
- Reverse Outer Price AB Entry & Entry AB Exit
- Reverse Outer Price AB Entry & Price AB Exit
- Reverse Outer Price AB Entry & Entry Within Exit
- Reverse Outer Price AB Entry & Price Within Exit
There are 8 BBands Calculation modes:
1. DATR Normal - This mode uses the DATR to calculate both the upper and lower bbands rather than use price. Since the DATR is directional, each BBand will be created using different data. "Normal" means it is being calculated using the standard bbands type of calculation.
2. DATR Alternative - This mode is the same as mode #1 but a different method is used to calculate the bbands.
3. DATR Normal Reversed - This mode is the same as mode #1 with the exception that the bbands are reversed, meaning the upper bband is used in place of the lower bband, and vice-versa.
4. DATR Alternative Reversed - This is the same as mode #2 with the exception that the bbands again are reversed.
5. Price Input - This mode uses price directly to calculate the bbands.
6. Price High & Low Normal - This mode uses the High to calculate the upper band and the low to calculate the lower band, instead of the close.
7. Price High & Low Normal Reversed - this mode is the same as mode #6 but with the bbands reversed.
8. Price High & Low Alternative - This mode is the same as mode #6 but uses the alternative way of calculating the bbands.
9. Price High & Low Alternative Reversed - This mode is the same as mode #8 but with the bbands reversed.
ATR Limit Measure Type
There are 8 ways you to test if you should get in the trade:
1. Close[0] - Close[1] - If the distance between the current close and the previous close is greater than the selected ATR limit then a red dot is printed on the chart. This is taken to mean that there's too much volatility and a trade shouldn't be ordered.
2. High - Low - This uses the range of the current candle to test if its greater than the ATR Limit.
3. Distance for the Exit Envelopes - This measures the distance from the trend exit envelope to the current close and prints a red dot if it's greater than the ATR Limit. The "trend exit envelope" is the red dotted line in the above image. Its the upper envelope in an uptrend, and vice-versa.
4. Distance From the Baseline - This is the default setting, if the distance from the current close to the baseline is greater than the ATR Limit, then red dot is printed.
5. Distance From the Exit Envelopes or Close[0] - Close[1] - this type generates a red dot when either the distance of the current close to the Exit Envelope, or the Close[0]-Close[1] is greater than the ATR Limit.
6. Distance From the Exit Envelopes or High - Low - this type generates a red dot when either the distance of the current close to the Exit Envelope, or the High-Low is greater than the ATR Limit.
7. Distance From the Baseline or Close[0] - Close[1] - this type generates a red dot when either the distance of the current close to the Baseline, or the Close[0]-Close[1] is greater than the ATR Limit.
8. Distance From the Baseline or High - Low - this type generates a red dot when either the distance of the current close to the Baseline, or the High-Low is greater than the ATR Limit.
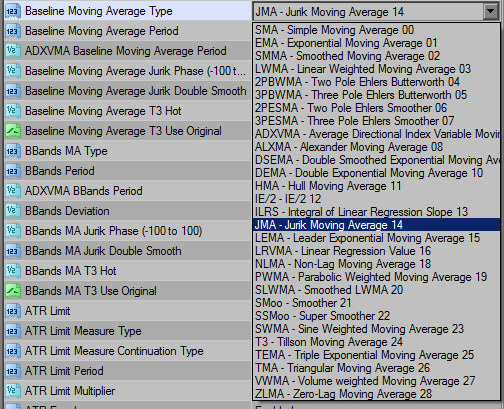
There are 33 moving average types to choose from, for both the baseline and the bbands calculation. You can also use a different period for the bbands than that used for the baseline. This allows for you to find a unique entry point.
To get a better idea of what the indicator does watch the video.
This version does not have any buttons so the subwindow indicator isn't required.
Requirements
MT4 - MetaTrader 4
Version 4.00 Build 1350 or greater
Feb. 11, 2022
Download the cQ-Baseline DATR BBands v1.1
You can find v1.0 down below.
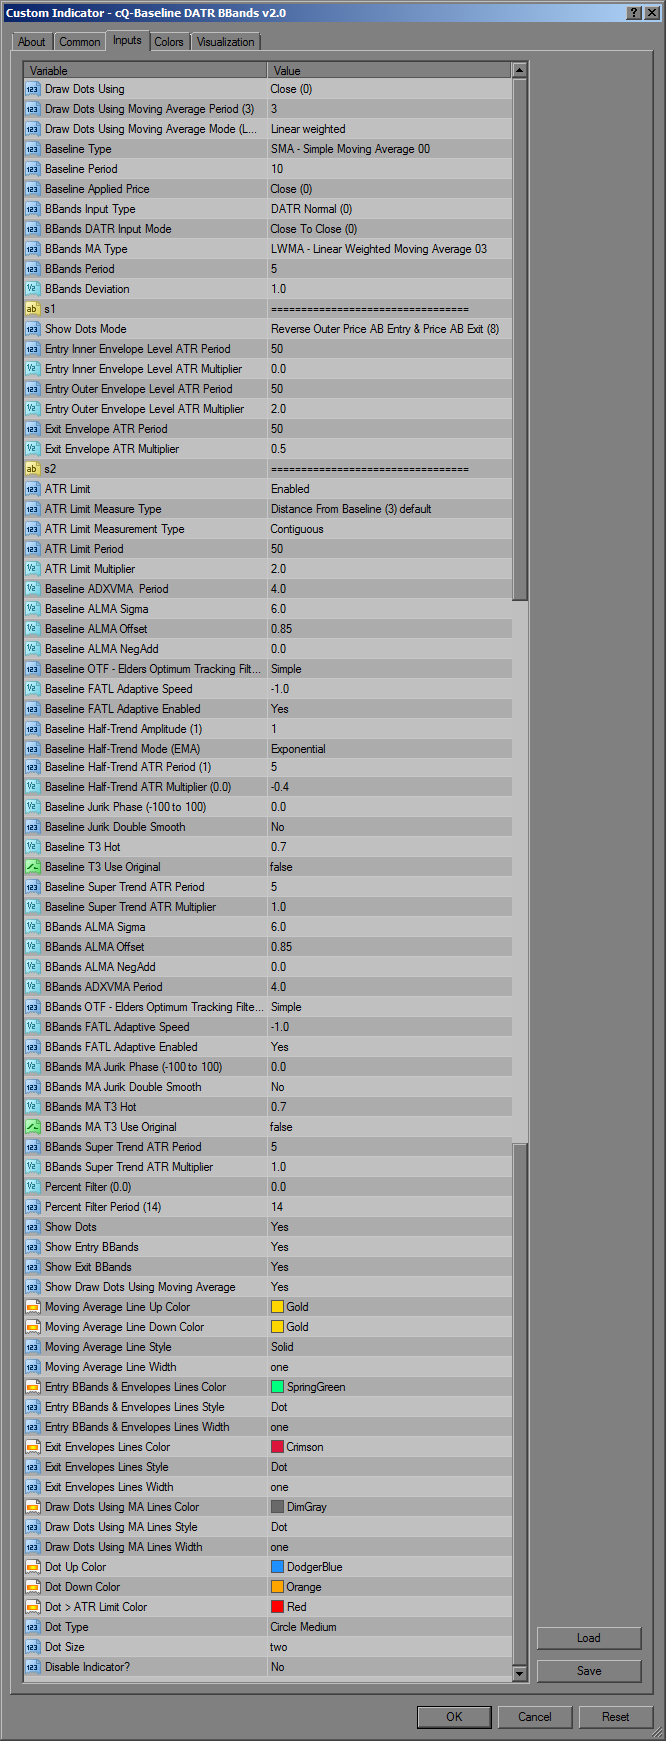
This is version 1.1 of the cQ-Baseline DATR BBands. It is a volume/confirmation indicator that uses BBands and Envelopes to filter out the entry points. You can use it in conjunction with your current volume indicator or by itself. It also be used as a entry filter.
It has 29 different moving averages for the baseline, and another 29 moving averages for the bbands. You can use a different moving average and period for the bbands calculation than that use for the baseline.
There are 3 Entry modes to choose from:
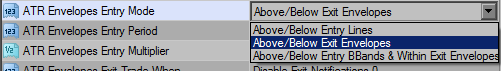
These modes determine how and when the dots are printed onto the chart.
The first is the Above/Below Entry Lines mode. In this mode the indicator will print a blue dot when price goes above the upper Entry BBand line (green dotted line, see the above image). It will print an orange dot when it goes below the lower BBand line (also green). The Entry Line is made up of both a BBand and an envelope. The envelope level is displayed if the BBands go above/below it's level. The Exit Envelope lines are used only for the generating an Exit signal (if enabled).
The second is the Above/Below Exit Envelopes mode. This is probably the mode most traders would be interested in using. It consists of the same Entry & Exit lines described in the first mode. In order for a dot to be printed on the chart, price must be above the Entry BBands (green dotted line) and the Entry BBands must be above the Exit Envelopes (red dotted line). This main difference is if the Entry BBands fall between Exit Envelopes then no dots are printed to the chart. This signify's that there isn't enough volume/volatility to enter.
The third is the Above/Below Entry BBands & Within Exit Envelopes mode. In this mode price needs to be above the Entry BBands line and the Entry BBands line must fall inbetween the Exit Envelope lines. If you watch the above video you will see an example. The Entry BBand lines are tied to the Exit Envelopes rather than the Baseline. They are also inverted which causes them to go down towards price in an uptrend, and go up towards price in a downtrend.
There are 11 BBands Calculation modes:
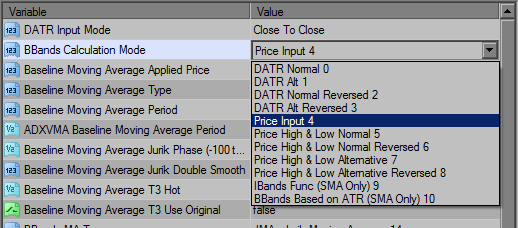
- DATR Normal
- DATR Alternative
- DATR Normal Reversed
- DATR Alternative Reversed
- Price Input
- Price High & Low Normal
- Price High & Low Normal Reversed
- Price High & Low Alternative
- Price High & Low Alternative Reversed
- iBands Function - This mode uses the MT4 iBands() to calculate the Baseline and BBands. It is limited to the SMA only. Changing the Moving Average type doesn't do anything.
- 11. BBands Based on the ATR - This mode uses the ATR to calculate the BBands. Currently it's also limited to using the SMA only. This should be changed in the next version update.
ATR Limit Measure Type
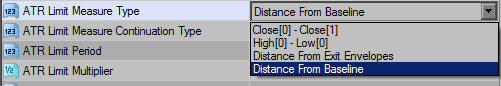
There are 4 ways you to test if you should get in the trade:
1. Current Close - Previous Close
2. High - Low
3. Distance for the Exit Envelopes
4. Distance From the Baseline
ATR Envelopes Exit Trade When
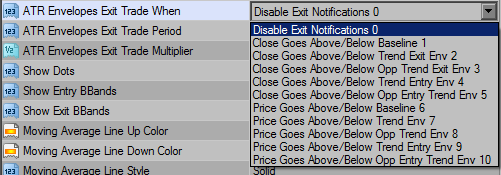
When price has generated an Entry dot an Exit dot will be generated when price does one of the following things:
1. Disable Exit Notifications - Doesn't generate any Exit 'X' noficiations.
2. Close Goes Above/Below Baseline - It will generate an exit notification if price closes on the opposite side of the baseline. In an uptrend it generates a nofication when price closes below the baseline.
3. Closes Above/Below Trend Exit Envelope - Generates an exit nofication when price closes below the upper exit envelope in an uptrend. It generates an exit notification when price closes above the lower exit envelope in a downtrend.
4. Closes Above/Below Opposite Trend Exit Envelope - Generates an exit nofication when price closes below the lower exit envelope in an uptrend, and generates an exit notification when price closes above the upper exit envelope in a downtrend.
5. Closes Above/Below Trend Entry Envelope - Generates an exit nofication when price closes below the upper entry envelope in an uptrend. It generates an exit notification when price closes above the lower entry envelope in a downtrend.
6. Closes Above/Below Opposite Trend Entry Envelope - Generates an exit nofication when price closes below the lower entry envelope in an uptrend, and generates an exit notification when price closes above the upper entry envelope in a downtrend.
The next 5 ATR Envelope Exit Trade When types are the exact same at the these with the except that realtime price and the high and low of the candle are used in place of the close. This will vary depending upon how it is used.
There are 29 moving average types to choose from, for both the baseline and the bbands calculation. You can also use a different period for the bbands than that used for the baseline. This allows for you to find a unique entry point.
Watch the video to get a better idea of what the indicator does.
This version does not have any buttons so the subwindow indicator isn't required.
Requirements
MT4 - MetaTrader 4
Version 4.00 Build 1160 or greater
Jan. 19, 2022
Download the cQ-Baseline DATR BBands v1.0
There are two versions in the zip file. One that uses the DATR (Directional ATR) and the other that uses price only.
The cQ-Baseline DATR BBands is volume/confirmation indicator that uses BBands and Envelopes to filter out the incorrect entry points. It could be considered a volume indicator when set to the appropriate settings. Basically in an uptrend, if the BBands are above the Envelopes and price goes above the BBands then a BUY Entry Dot is printed on the chart. In a downtrend the opposite occurs, when the BBands are below the Envelopes and price goes below the BBands then a SELL Entry Dot is printed.
There are 28 moving average types to select for both the Baseline and the BBands. You can use a different moving average type for the BBands as well as a different period.
There is an ATR Limit function that prints a Red Dot when the current candle's range is over 2 times the ATR (you can change this value). It works either in a Single Shot or Continue way. Single Shot only printed on candles that are over the 2 times ATR limit. Continue will print red dots on each candle until price drops above/below the BBands or a trend change occurs. Its easier than you think. There are two different range settings: High-Low, and Current Close - Previous-Close for determining the range of the candle.
The indicator can opperate in two different modes: the first being as previously explained, the second being an entry point is printed when price goes above/below the Entry Level (BBands) and above the Envelopes as in the first mode. The difference is there is another Entry Envelope from which if the BBands fall below this Envelope then the Envelope level is shown. If price is above/below this envelope level then no entry point is printed on the chart. Watch the video to get a better idea or just download the indicator and check it out.
It also has an Exit function that uses the Entry BBands/Envelopes, Exit Envelopes, and the Baseline as exit points. You can have it print to the screen (or expert advisor) when either price closes above/below the exit level or if price crosses (above/below) the exit level.
Watch the video to get a better idea of what the indicator does.
This version does not have any buttons so the subwindow indicator isn't required.